martes, 18 de noviembre de 2014

Why gold may have just capitulated


Big money is running away from gold.

According to data from the U.S. Commodity Futures Trading Commission (CFTC), "managed money" (as in fund managers) have been getting out of gold over the past three weeks at their fastest rate in 2014. And last week, the World Gold Council reported demand for gold bars and coins fell 21 percent in the third quarter of this year compared with  last year.

But with both small and large investors now having seemingly fled gold, is there anyone left to sell?

"This fleeing from gold in terms of the flows does represent a big capitulation," said Gina Sanchez, founder of Chantico Global. "However in the short-term, this could actually represent a massive overselling."

In the end, a long-term outlook for higher U.S. interest rates, a subsequently stronger dollar, and an improving economy will do their part to bring bullion lower, argues Sanchez, a CNBC contributor. "The long term really isn't going to be a free-fall," she predicted. "It's just going to be a continued devaluation of gold relative to other currencies."

The charts don't look much better according to one well-followed technician.

View gallery

.

"Gold still looks negative here," said Mark Newton, chief technical analyst at Greywolf Execution Partners. "With the U.S. dollar rallying, we continue to think that gold is going to move lower. My target is down near $1,100 – between $1,080 and $1,111."

Gold may have made its way back above a major support level around $1,180 to $1,190 broken a few weeks ago, notes Newton, but the recent rally may not be enough evidence it has turned itself around, he maintains. "Gold bulls are really going to need to see gold move back up above an area near $1,255 to think that lows are in and the metal can continue to rise," he said.

View gallery

.

And it is in the long-term chart that Newton sees an important support level where he thinks gold is headed. "Gold has gotten a bit oversold and we've gotten very pessimistic," he said, "but it's still likely we can move down towards $1,080, which is 50 percent of the entire rally from 1999 up to 2011. Potentially, gold could bottom out but I still think it happens from lower levels. Structurally, it's wrong to get too bullish here just yet based on a couple of days' movement. I'm still very pessimistic."

LikeTweet

Why now is a great time to sell gold


Gold may be inching its way back to $1,200 per troy ounce but one major bank is saying shorting the yellow metal is one of the best ideas for 2015.

In a recent report, Credit Suisse global head of technical analysis David Sneddon makes the case for gold to trade down to $950 by the end of next year. That would mean a 20 percent drop from Tuesday's prices.

In the last two years, the price of bullion has declined 30 percent, and it's 37 percent off its 2011 record high.

(Watch: Why is Putin buying gold?)

But can gold sink to $950 in the next 13 months? One trader believes so and has even taken a position on it.

"I am short gold long term," said David Seaburg, head of sales trading at Cowen and Company. Though he did predict a short-term pop for gold on "Talking Numbers" two weeks ago, he believes the metal is headed down.

"You're going to have little pockets of trades that occur as we get more global uncertainty," Seaburg said. "But ultimately I think the trajectory for gold is down, and I do believe that being short it is the trade right now."

(Read: Gold ends near $1,200 on soft dollar; highest since Oct)

Seaburg cites several reasons why gold is in trouble. With foreign central banks adding stimulus to their economies, their currencies are depreciating against the U.S. dollar. A stronger greenback is negative for dollar-denominated bullion. As well, inflation is not a concern so the need for gold to be a safe-haven asset is diminished.

"I can make an argument right now that U.S. equities are right now the ultimate safe-haven asset," Seaburg said. "I am a short-seller of gold and I think it's going a lot lower. I think $950 is definitely in sight."

View photo

.

The technicals corroborate Seaburg's thesis, said Ari Wald, head of technical analysis at Oppenheimer & Co.

"Gold has been trying to stabilize for the last year but I don't see this as a very strong base," he said, looking at a chart of gold. Wald considers a downward turn in the 200-day moving average and the recent drop below $1,200 per ounce as a negative signs, too. "That is indicating a resumption of this long-term downtrend that started in 2012," he said.

Gold is also about to hit resistance at its 50-day moving average, currently at $1,210. "I see this as a great time to sell gold," Wald said.

LikeTweet

Australia Pacific: Production down due to asset sales


Barrick Gold: Strong 3Q14 earnings, important opportunities (Part 9 of 16)

(Continued from Part 8)

Australia Pacific's assets

Barrick Gold Corporation's (ABX) Australia Pacific unit includes its 95% interest in the Porgera mine and the Cowal mine, and its 50% interest in the Kalgoorlie mine. The remaining 50% is owned by Newmont Mining (NEM). In its ongoing portfolio optimization efforts, Barrick Gold (ABX) sold Yilgarn South and Plutonic, its other two interests in Australia Pacific, and divested its interest in the Kanowna mine.

Production down due to asset sales

Following the sales of Yilgarn South, Kanowna, and Plutonic assets in this division, Barrick's gold production decreased by 41% in 3Q14 from the third quarter of last year. Production for the remaining sites was higher than the previous corresponding period of 3Q14. Total production for Australia Pacific was 292,000 ounces. All-in sustaining costs (or AISC) was $855 per ounce, a decrease of $65 per ounce due to a decrease in mine-site sustaining capital expenditure.

Improved guidance

Production guidance for 2014 has increased to 1.05 to 1.125 million ounces due to higher production rates at Porgera Mine. This increase was due to higher throughput and processed grade resulting from higher-than-expected ore tons from Stage 5A of the open pit and higher tons from the underground as mining rates continue to ramp up. AISC guidance was also reduced to $885 to $910 per ounce. This is mainly due to the impact of higher production and lower direct operating costs as a result of lower power costs at Cowal and lower open-pit costs at Porgera.

Barrick Gold recently changed the mine plan for Porgera and Kalgoorlie and went for high grading, or mining the higher-grade part of the mine first. Barrick Gold's (ABX) peers, including Newmont Mining Corp (NEM), Freeport-McMoRan Inc (FCX), and Randgold Resources Ltd (GOLD), are also facing increasing costs. As a result, mine-plan changes have been initiated at these companies as well.

The Market Vectors Gold Miners exchange-traded fund (or ETF) (GDX) invests in big gold producers, while the Standard and Poors depositary receipt (or SPDR) Gold Trust ETF (GLD) provides exposure to the spot gold prices.

Continue to Part 10

Browse this series on Market Realist:

  • Part 1 – Barrick Gold reports strong 3Q14 earnings
  • Part 2 – World's largest gold producer: Barrick Gold
  • Part 3 – Barrick's Cortez mine: Production down year-over-year

LikeTweet

The Commodity Supercycle Ain't Over - Yet

image

As surprising as it might sound today, we believe the secular trend for commodities has higher elevations to travel, before eventually running its course – possibly as far out as early into the next decade. While in 2011 we became adamant that the thesis trade in commodities – specifically in its leading sector of precious metals, had become crowded and overhyped, those excesses have been wrung out of the markets over the past three and a half years and offer what we perceive to be extremely compelling long-term valuations going forward. 

This idea remains supported by our research that implies yields are not headed materially higher anytime soon – despite the anxieties surrounding the Fed raising interest rates over the next few years. Moreover, we expect that real yields (nominal – inflation) will remain suppressed and eventually retrace the rise that began in the back half of 2011. 

When the real yield cycle finds its zero bound and breaks below, commodities tend to outperform in the market over an extended period of time. All things considered, the death knell spike in real yields that has historically punctuated the end of major commodity booms in the past – has yet to appear for us on the horizon. 

Over the years we have shown a long-term Hawking view of the nominal yield cosmos, which depicts an antithetic and gradual troughing, versus the violent and exhaustive secular peak in yields the markets experienced in the early 1980's. While 10-year yields this year have retraced back to the mid point of our expected range (1.5%-3.0%), taking into account the symmetrical structure and mirrored return of the long-term yield cycle,  an estimated secular pivot higher would not take place until early in the next decade. 

When it comes to a roadmap for short-term yields going forward, we looked back at the last time 3 month Treasury yields broke below 0.5% in 1934 and troughed over the next 13 years until 1947. Notwithstanding the failed rate hike regime by the Fed in 1937, the current market has closely followed the historic comparative performance trajectory of that time. Interestingly, by normalizing a duration study to that period (see below), the estimated run below 0.5% would also extend early into the next decade. 

From our perspective, the broader cycle takeaways are:

- Although the Fed may tweak short-term yields gradually higher at some point in the future, the expectations by participants of a one – and certainly two or three handle, in front of the fed funds rate – appear wildly optimistic over the next few years.

- We believe the extended and gradual basing structure of the historic cycle reflects more realistic expectations for yields and the natural equilibrium that the Fed will ultimately be guided and constrained by – just as they were across the trough of the cycle last time around. 

As shown in our first chart that depicts both the long-term nominal and real yield cycles, commodities have outperformed along runs leading up to the nominal peak in yields and through the nominal trough of the cycle. From a comparative perspective, the 1970's commodity boom that ran commensurate with the yield peak was roughly half the duration of the commodity boom that ran through the trough in the 1930's and into the early 1950's. This makes logical sense to us, considering what we know of the nominal yield cycles structure – i.e. shorter exhaustive highs versus long drawn out troughs.

When comparing the performance of the CRB index between the 1970's supercycle and today, you might come to the initial conclusion that the current cycle hasn't been that super after all. In fact, the current cycle (as expressed by the CRB) would roughly fit within the performance envelope of the first leg of the 1970's market (71'-78') – despite being more than twice as long. Complicating the tea leaves of the current market was the major currency dislocations in the financial crisis, which caused an overshot on both the top and bottom sides of the performance ranges. 

That said, when we extrapolate a normalized comparative study – balanced by momentum (RSI and stochastics) signatures across the complete run of the 1971-1980 boom, we find an estimated comparative leg higher up to the early part of the next decade. Fittingly, this would roughly match the duration of the previous commodity boom that extended for ~20 years along the mirrored trough of the long-term yield cycle in the early 1930's and 1950's.

image
While the recent prognostications of $700/ounce gold and $50/barrel oil make for great hyperbole by the bears and in the punditsphere, we view them as the typical overshots that are thrown around during the final throes of capitulation. In as much as markets tend to overshoot significant moves, expectations soon follow – always in the same direction of where a market has been trending. With commodities remaining under pressure since Q2 2011, recency biases have entrenched towards further downside in the future. For gold to reach $700/ounce or oil $50/barrel, real yields would be pushed significantly higher – essentially repeating the performance declines for both assets that began in 2011. From what our anticipated range implies for nominal yields over the next few years and h ow eroded inflation expectations have become today, both targets appear grossly unrealistic. Contrary to conventional wisdom in the market today, we still believe hard commodities such as gold and oil will once again outperform – greatly supported by the tangential performance trends in catalysts such as China and emerging markets. 

You'll find that for many of the commodity cycle bears today, their theses hinge on a continued catalytic decline in China. This is predominantly because China had played such a pivotal role through the first boom of the commodity cycle in the massive demand created by significant investments in infrastructure and urban development. While the excesses in China have been well described and rigorously debated for the better part of this decade, the just how bad the crash will be expectations by the policy bears have so far been largely unfounded. 

Quite the contrary, although these concerns remain at the forefront of debate as growth in China has slowed, the leading edge in their equity markets have surprised (finally) many this year – and broken out from a 5 year consolidating range. 
image

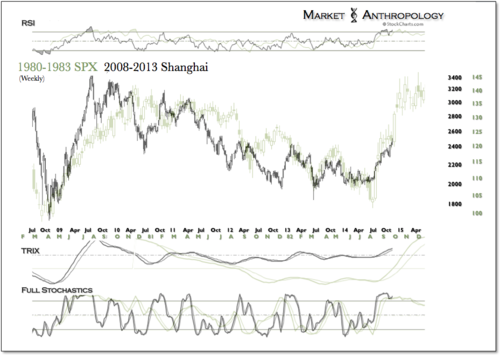
As much as their arguments are well founded with cogent logic, the reality becomes that  increased capital flows and resurrected confidence in Chinese markets will have a mitigating effect on the immanent credit conditions that academics and strategists such as Paul Krugman and Michael Pettis have been greatly concerned with over the past several years – and whom largely expected significant pressures to remain on the commodity markets as China would be forced into a long and painful economic rebalancing. 

While it remains to be seen weather China has its comparative 82' awakening (see above) or its much anticipated bust, we do believe the recent positive developments in their capital markets will provide a constructive rather than destructive environment for the commodity sector over the next year. All things considered, we'll still take that bet and doubt we will ever see $700 gold or $50 oil again in our lifetime. From our perspective, $1400 and $100 appear more likely in 2015 – and by 2022… the super may have shown up again in this cycle.

LikeTweet

lunes, 17 de noviembre de 2014

Anatomy of a Nasdaq 100 Scan

The stock market's ability to close higher last week has improved the weekly technical outlook but the volume is still not confirming the price action.  Nevertheless, the short-term momentum is positive as we enter a two-week seasonal period where stocks are generally weak.

The PowerShares QQQ Trust (QQQ) is still a market leader as it is up over 18.2% YTD compared to just a 12.1% gain in the Spyder Trust (SPY).  As I outlined in Friday's Week Ahead column Two Potential Stock Market Scenarios, there are two paths for the stock market that I think are the most likely for the next few weeks.

Whether the market sees a sharp setback or a period of sideways consolidation, there are some stocks that are just in the process of bottoming and are likely to diverge from the overall market. Therefore, I continue to run my regular weekly scans to find those stocks that look the most promising.

One of the scans focused on the Nasdaq 100 stocks as I first looked for those stocks where the OBV was above its WMA. For the Nasdaq 100, there were 58 stocks that met this criteria.

This group of stocks was then analyzed further to isolate those where the daily OBV has just moved above its WMA. These stocks had, therefore, just triggered a buy signal from Aspray's OBV Trigger (AOT).

Only nine of the 58 stocks passed this test. I then examined these stocks basis their charts and relative performance analysis. Here are three that looked the most interesting.


Click to Enlarge

Chart Analysis: The PowerShares QQQ Trust (QQQ) closed last week at $103.21, which is just barely below the weekly starc+ band at $103.91.

  • The quarterly projected pivot resistance is at $104.74, and in the 3rd quarter, the QQQ came close to the quarterly resistance before the October decline.
  • There is initial weekly support now at $100-$100.67, which also corresponds to the 20-day WMA.
  • There is more important support at the quarterly pivot, which stands at $97.59.
  • The relative performance closed the week at a new high, further confirming the QQQ as a market leader.
  • The RS line broke through major resistance, line c, in July.
  • The weekly OBV just moved back above its WMA last week.
  • The daily OBV (not shown) is well above its WMA and confirming the price action.

A surprising stock that showed up in the scan was Randgold Resources (GOLD), a $6.7 billion sub-Saharan gold mining company.

  • It has clearly been diverging from gold prices as hedge funds cut their long futures and option positions by 14% last week.
  • GOLD is up 10.2% YTD, while the SPDR Gold Shares (GLD) is down 1.4%.
  • The weekly chart shows that GOLD has formed lower lows, line f, going back to 2013.
  • GOLD came close to its weekly starc- band three weeks ago.
  • The relative performance did drop below support (line h) at the November lows.
  • A move in the RS above the resistance at line g, is needed to signal that it is a market leader.
  • The weekly on-balance volume (OBV) has formed a long-term bullish divergence, line j, that goes back to the early 2014 lows.
  • The OBV is back above its WMA and has key resistance at line i.
  • The 20-day EMA is at $65.14 with the monthly pivot at $62.37.

Click to Enlarge

Broadcom Corp. (BRCM) made new highs for the year on Friday as it closed not too far below the weekly starc+ band at $43.42.

  • The long-term chart shows a basing formation going back to 2002 (I will Tweet later) with key resistance at $44.97 to $47.41.
  • A move above this major resistance could complete a long-term bottom as BRCM peaked at over $173 in 2000.
  • The weekly chart shows a band of good support in the $37.80 to $39.80 area, line a.
  • This also corresponds to the quarterly pivot ($39.50) and quarterly support ($37.36).
  • The weekly chart shows a strong uptrend (line b) that goes back to the 2013 lows.
  • The weekly RS line also shows a solid uptrend, line c, consistent with a market leader.
  • The RS line is also above its WMA.
  • The OBV now shows a short-term uptrend, line d, as it has just moved back above its WMA.

Wynn Resorts Ltd. (WYNN) has held up well despite reporting a decrease in revenues in September. This was mainly tied to lower revenues from Macau and the stock is down 2% YTD.

  • The weekly chart shows a well established downtrend from the early 2014 highs, line e.
  • This decline has dropped the stock into the 38.2-50% support of the rally from the July 2012 lows.
  • The 20-day EMA is at $189.70 with further weekly resistance at $192.45.
  • The weekly relative performance also shows a well established downtrend, line f.
  • The RS line turned up last week but is still below its WMA.
  • The weekly OBV looks more positive as it has broken its downtrend, line g, and moved above its WMA.
  • The daily OBV (not shown) is still negative.
  • There is initial support now at $178-$180 area with stronger at $176.50.
  • A drop below the 168.80 level would abort the bottom formation.

What it Means: All three of these stocks should be watched even though the Powershares QQQ Trust (QQQ) is in a high risk buy area.  My recent analysis of gold and the gold miners suggested it would take several weeks or more before they could bottom.

Last Friday's sharp rally was impressive, but would wait for weekly/daily confirmation of a bottom for the whole industry before buying Randgold Resources (GOLD).

I will be watching both Broadcom Corp. (BRCM) and Wynn Resorts Ltd. (WYNN) for a good entry points.

How to Profit: No new recommendation.

LikeTweet

viernes, 14 de noviembre de 2014

3 Stocks Raising The Metals & Mining Industry Higher


Editor’s Note: Any reference to TheStreet Ratings and its underlying recommendation does not reflect the opinion of TheStreet, Inc. or any of its contributors including Jim Cramer or Stephanie Link.

One out of the three major indices are trading lower today with the
Dow Jones Industrial Average (
^DJI) trading down 15 points (-0.1%) at 17,638 as of Friday, Nov. 14, 2014, 12:00 PM ET. The NYSE advances/declines ratio sits at 1,511 issues advancing vs. 1,431 declining with 199 unchanged.

The Metals & Mining industry currently sits up 1.3% versus the S&P 500, which is unchanged. Top gainers within the industry include
Eldorado Gold (
EGO), up 5.0%,
Franco-Nevada (
FNV), up 3.8%,
Barrick Gold (
ABX), up 3.0%,
Goldcorp (
GG), up 2.6% and
Silver Wheaton (
SLW), up 2.7%. On the negative front, top decliners within the industry include
Turquoise Hill Resources (
TRQ), down 1.4%, and
POSCO (
PKX), down 1.0%.

TheStreet would like to highlight 3 stocks pushing the industry higher today:

3.
Southern Copper (
SCCO) is one of the companies pushing the Metals & Mining industry higher today. As of noon trading, Southern Copper is up $0.41 (1.4%) to $29.80 on light volume. Thus far, 514,270 shares of Southern Copper exchanged hands as compared to its average daily volume of 1.9 million shares. The stock has ranged in price between $29.02-$29.82 after having opened the day at $29.21 as compared to the previous trading day’s close of $29.39.

STOCKS TO BUY: TheStreet Quant Ratings has identified a handful of stocks that can potentially TRIPLE in the next 12 months. Learn more.

Southern Copper Corporation is engaged in the mining, exploring, smelting, and refining copper and other minerals in Peru, Mexico, Argentina, Chile, and Ecuador. Southern Copper has a market cap of $24.5 billion and is part of the basic materials sector. Shares are up 2.4% year-to-date as of the close of trading on Thursday. Currently there are 4 analysts who rate Southern Copper a buy, no analysts rate it a sell, and 4 rate it a hold.

TheStreet Ratings rates
Southern Copper as a
buy. The company’s strengths can be seen in multiple areas, such as its revenue growth, largely solid financial position with reasonable debt levels by most measures, expanding profit margins, increase in stock price during the past year and notable return on equity. We feel these strengths outweigh the fact that the company has had sub par growth in net income. Get the full
Southern Copper Ratings Report now.

STOCKS TO BUY: TheStreet Quant Ratings has identified a handful of stocks that can potentially TRIPLE in the next 12 months. Learn more.


1 of 3


Check Out Our Best Services for Investors

Action Alerts PLUS

Jim Cramer and Stephanie Link reveal their investment tactics while giving advanced notice before every trade.

Product Features:
  • $2.5+ million portfolio
  • Large-cap and dividend focus
  • Intraday trade alerts from Cramer
Quant Ratings

Access the tool that DOMINATES the Russell 2000 and the S&P 500.

Product Features:
  • Buy, hold, or sell recommendations for over 4,300 stocks
  • Unlimited research reports on your favorite stocks
  • A custom stock screener
Stocks Under $10

Jim Cramer’s protégé, David Peltier, uncovers low dollar stocks with extraordinary upside potential that are flying under Wall Street’s radar.

Product Features:
  • Model portfolio
  • Stocks trading below $10
  • Intraday trade alerts
Try it NOW
Try it NOW
Try it NOW

View other subscription services that we offer


For more information on Agnico Eagle Mines Ltd click any of the following:

  • Agnico Eagle Mines Ltd Stock Price

  • Agnico Eagle Mines Ltd Analyst
    Ratings

  • Agnico Eagle Mines Ltd Key Stats &
    Profile

  • Agnico Eagle Mines Ltd Earnings

  • Agnico Eagle Mines Ltd Ratio
    Comparison

  • Agnico Eagle Mines Ltd Growth Rates

  • Agnico Eagle Mines Ltd Balance Sheet

  • Agnico Eagle Mines Ltd Cash Flow

  • Agnico Eagle Mines Ltd Income Statement

LikeTweet

martes, 11 de noviembre de 2014

Gold is doing something it hasn't done in 17 years


Gold bugs are having flashbacks of the late '90s.

But it's not Hanson or "Seinfeld" on their minds. Instead, it's the sobering realization that gold is about to do something depressing.

If gold were to close out the year right now where it is, it would be looking at its first back-to-back yearly loss since 1997. The precious metal is currently off almost 4 percent on the year. The surging dollar and lack of inflation has taken the shine off gold. But with so much going wrong, could now be the time to buy bullion?

"I think gold is headed straight down," said CNBC contributor Gina Sanchez, founder of Chantico Global. She sees a stronger dollar, economic optimism and rising rates ahead for the U.S. all conspiring to push the metal's price down. Add to that flat inflation in China and the potential of deflation in Europe and you have a recipe for cheaper gold.

"None of those things are going to support gold," Sanchez said. "You might get some firming in the physical markets but it's just not enough to combat the outflows in the financial markets."

The charts don't look much better.

View photo

.

"What we're seeing in the trend is that this can continue," said Ari Wald, head of technical analysis at Oppenheimer & Co. "We would be playing for lower gold prices. As pessimistic as sentiment has gotten, we think it becomes more pessimistic."

For well over a year, gold has been making a base, with support around $1,200 per ounce, according to Wald's charts. But with prices falling below that level, that may have failed.

"We see $1,200 now as resistance and we are viewing this as a resumption of the very long-term downtrend that started in 2012," Wald said. "Until gold can stabilize, we see downside risk to $1,000."

The $1,000 level is significant technically, not just because it's a nice round number but because it was strong resistance in the time between 2007 and 2009, said Wald.

"It was prior resistance for a few years in there and I think that might be a floor here," he said. "The worst-case scenario is gold can't stabilize and the trend continues lower."

LikeTweet

sábado, 8 de noviembre de 2014

Randgold Resources announces 3rd Quarter Results


JERSEY, CHANNEL ISLANDS–(Marketwired – Nov 6, 2014) – Randgold Resources (NASDAQ: GOLD)(LSE: RRS)

NASDAQ: GOLD
LSE: RRS

RANDGOLD RESOURCES LIMITED
Incorporated in Jersey, Channel Islands
Reg. No. 62686
LSE Trading Symbol: RRS
NASDAQ Trading Symbol: GOLD

ROBUST Q3 RESULTS POINT WAY TO RECORD YEAR FOR RANDGOLD

London, Thursday 6 November 2014 - The ongoing ramp-up of the Kibali
mine led a strong overall performance by all of Randgold's operations
in a quarter in which production reached a new record level and costs
were well contained.

Results for the three months to September, released today, show
production of 299 320 ounces, up 8% on the previous quarter.
Production for the first nine months of the year was up 37% on the
comparable period in 2013, reflecting Kibali's contribution and the
impact of expansion and upgrade projects at the other operations.
Total cash cost per ounce of $692/oz was well contained, down 1% on
the previous quarter.

Earnings per share increased by 11% to $0.63 quarter on quarter but
profit was affected by foreign exchange adjustments and at $66.0
million was just marginally ahead of the previous quarter. Profit from
mining of $172.6 million was up 6% quarter on quarter. By the end of
the quarter, Randgold had returned to its debt-free status, having
repaid its revolving credit facility.

Kibali is nearing operational stability as it continues to ramp up
mining and production, and the operation is well on its way to
achieving its goal of delivering an average of 650 000 ounces per year
over the next 10 years, chief executive Mark Bristow said. The mine
produced 145 152 ounces in Q3, substantially up on Q2's 91 137 ounces.
Production at the group's flagship Loulo-Gounkoto complex was 8% down
at 160 286 ounces but Bristow said it was still on track to exceed its
2014 guidance of 640 000 ounces.

RANDGOLD ENQUIRIES:

Chief Executive Financial Director Investor & Media Relations
Mark Bristow Graham Shuttleworth Kathy du Plessis
+44 788 071 1386 +44 1534 735 333 +44 20 7557 7738
+44 779 775 2288 +44 779 771 1338 Email:randgold@dpapr.com

Website: www.randgoldresources.com

------------------------------------------------------------------------

Click on, or paste the following link into your web browser, to view
the associated PDF document.

http://www.rns-pdf.londonstockexchange.com/rns/2817W_1-2014-11-5.pdf

This information is provided by RNS
The company news service from the London Stock Exchange

END

Contact:

RNS
Customer Services
0044-207797-4400
Email Contact
http://www.rns.com

LikeTweet

viernes, 7 de noviembre de 2014

Dealing in securities by a non-executive director of AngloGold Ashanti Limited

Acrobat Version

In terms of paragraphs 3.63 to 3.65 of the JSE Limited Listings Requirement (“Listings Requirements”), AngloGold Ashanti gives notice that a non-executive director of the company has purchased ordinary shares of the company, after receiving clearance to do so as required by paragraph 3.66 of the Listings Requirements.

Details of the purchase are provided below:

 Name of director  Michael Kirkwood
 Name of company  AngloGold Ashanti Limited
 Date of transaction  04 November 2014
 Nature of transaction  On-market purchase of shares
 Class of security  American Depositary Receipts (ADRs)*
 Number of shares  5,000
 Volume weighted average price
of shares purchased
 USD9.3821
 Lowest price of shares purchased  USD9.38
 Highest price of shares purchased  USD9.415
 Total value of shares purchased (excluding
brokerage and other fees)
 USD46,910.22
 Nature of interest  Beneficial Owner

ENDS

JSE SPONSOR: Deutsche Securities (SA) Proprietary Ltd


LikeTweet

The most difficult choice any investor could make


Here’s a scary choice. Gold, or gold miners.

Only the most sadistic of traders would want to make the choice, but if you believe the yellow metal is done falling, and you’re made of sterner stuff, the choice could reap dividends.

The world's largest gold-backed fund (trading under the symbol GLD) has taken a 12 percent hit in the last three months and is down for the year as is gold itself.

Meanwhile, though the gold miners ETF (trading under the symbol GDX) rallied 4 percent on Thursday, it traded at a record low of $16.45 per share on Wednesday. The GDX is down 34 percent in the last 90 days.

So if investors had to choose one, which would it be – the GLD or the GDX?

(Read: Gold edges of lows as dollar slips from 4-year peak)

The GLD is safer, though perhaps not as potentially lucrative, compared with the GDX in the short term, according to David Seaburg, head of equity sales trading at Cowen and Company.

"There's a trade in gold here, and I think the trade is for a short-term pop to the upside," Seaburg said. That pop could come because he sees positions in long U.S. dollar/short gold to be "crowded" right now. So, how investors would take advantage of a temporary reversal would depend on their risk appetite.

"The GLD I like as a more conservative approach to it," Seaburg said. "The GDX is a much more leveraged to it. It's really based on your risk perspective."

(Read: Euro plunges to its lowest in more than two years)

However, the long-term prospects for gold remain bleak, if he is correct. "You're going to see the dollar index continue to go higher," Seaburg said. "However, there's really no inflation in sight. People are talking deflation. So the longer-term prospects for gold in my opinion are not good."

View photo

.

But buying into gold may not be the best idea if the chart work of one leading technical analyst is to be believed.

"From a long-term perspective, the primary trend is lower on gold," said Craig Johnson, senior technical analyst at Piper Jaffray and president of the Market Technicians Association.

Johnson likens the current environment to the peak in gold during a breakout in bonds and equities in the early 1980s. "If history is going to rhyme and perhaps even repeat with what we've seen in the past," he said, "gold is not going to work. The best days are behind us for gold."

He said that the GLD recently broke below key support and may be headed down further. "We've been looking for about $100 on that particular ETF and we think that's going to be achieved," he said. "We're a seller of gold because we think a lot more downside is still yet to be had."

LikeTweet

Dealing in securities by the chief executive officer of AngloGold Ashanti Limited

Dealing in securities by the chief executive officer of AngloGold Ashanti Limited

Acrobat Version

In terms of paragraphs 3.63 to 3.65 of the JSE Limited Listings Requirement (“Listings Requirements”), AngloGold Ashanti gives notice that the Chief Executive Officer (Executive Director) of the company has purchased ordinary shares of the company, after receiving clearance to do so as required by paragraph 3.66 of the Listings Requirements.

Details of the purchase are provided below:

 Name of director  Srinivasan Venkatakrishnan
 Name of company  AngloGold Ashanti Limited
 Date of transaction  04 November 2014
 Nature of transaction  On-market purchase of shares
 Class of security  Ordinary Shares
 Number of shares  5,000
 Volume weighted average price
of shares purchased
 R107.987
 Lowest price of shares purchased  R107.78
 Highest price of shares purchased  R108.01
 Total value of shares purchased (excluding
brokerage and other fees)
 R539,936.62
 Nature of interest  Direct Beneficial

This purchase of 5,000 shares by Mr Srinivasan Venkatakrishnan, together with previous purchases (excluding share options that have vested but unexercised), takes Mr Venkatakrishnan’s equity shareholding in AngloGold Ashanti from 81,009 shares to 86,009 shares.

ENDS

JSE SPONSOR: Deutsche Securities (SA) Proprietary Ltd


LikeTweet

Randgold Resources: TR-1 Amendment


JERSEY, CHANNEL ISLANDS–(Marketwired – Nov 7, 2014) – The TR-1 Randgold Resources (LSE: RRS) (NASDAQ: GOLD) announcement released on 28 October 2014 at 07:26 under RNS No 4429V has been amended. The amendment is identified between two asterisks in paragraph 7 below (i.e. *below*).

The full amended text is set out in full as follows.

RANDGOLD RESOURCES LIMITED
Incorporated in Jersey, Channel Islands

Reg. No. 62686

LSE Trading Symbol: RRS

Nasdaq Trading Symbol: GOLD

(“Randgold Resources” or the “Company”)

London, 28 October 2014

 
TR-1: NOTIFICATION OF MAJOR INTEREST IN SHARESi
1. Identity of the issuer or the underlying issuer of existing shares to which voting rights are attached:ii Randgold Resources Limited
2. Reason for the notification (please tick the appropriate box or boxes):
An acquisition or disposal of voting rights x
An acquisition or disposal of qualifying financial instruments which may result in the acquisition of shares already issued to which voting rights are attached  
An acquisition or disposal of instruments with similar economic effect to qualifying financial instruments  
An event changing the breakdown of voting rights  
Other (please specify):  
3. Full name of person(s) subject to the notification obligation:iii BlackRock, Inc.
4. Full name of shareholder(s) (if different from 3.):iv  
5. Date of the transaction and date on which the threshold is crossed or reached:v 24th October 2014
6. Date on which issuer notified: 27th October 2014
7. Threshold(s) that is/are crossed or reached: vi, vii Holding has gone *below* 16%
8. Notified details:
A: Voting rights attached to sharesviii, ix
Class/type of shares if possible using the ISIN CODE   Situation previous

to the triggering

transaction
  Resulting situation after the triggering transaction
Number

of

Shares
  Number

of

Voting

Rights
  Number

of shares
  Number of voting

rights
  % of voting rights x
Direct   Direct xi   Indirect xii   Direct   Indirect
GB00B01C3S32   14,811,371   14,811,371   N/A   N/A   14,791,281   N/A   15.96%
B: Qualifying Financial Instruments
Resulting situation after the triggering transaction
Type of financial instrument   Expiration date xiii   Exercise/ Conversion Period xiv   Number of voting rights that may be acquired if the instrument is exercised/ converted.   % of voting rights
                 
C: Financial Instruments with similar economic effect to Qualifying Financial Instruments xv, xvi
Resulting situation after the triggering transaction
Type of financial instrument   Exercise price   Expiration date xvii   Exercise/

Conversion period
xviii
  Number of voting rights instrument refers to   % of voting rights xix, xx
CFD               13,850     Nominal     Delta
  0.01%   0.01%
  Total (A+B+C)
  Number of voting rights   Percentage of voting rights
  14,805,131   15.98%
9. Chain of controlled undertakings through which the voting rights and/or the financial instruments are effectively held, if applicable: xxi
 
Proxy Voting:
10. Name of the proxy holder:  
11. Number of voting rights proxy holder will cease to hold:  
12. Date on which proxy holder will cease to hold voting rights:  
13. Additional information:   BlackRock Regulatory Threshold Reporting Team
14. Contact name:   Gareth Slade
15. Contact telephone number:   020 7743 2536
Annex: Notification of major interests in sharesxxii
A: Identity of the persons or legal entity subject to the notification obligation
Full name
(including legal form of legal entities)
  BlackRock, Inc.
Contact address
(registered office for legal entities)
  55 East 52nd Street, New York, NY 10055

United States of America
Phone number & email   020 7743 2536
EMEAdisclsoure@blackrock.com
Other useful information
(at least legal representative for legal persons)
  Gareth Slade
B: Identity of the notifier, if applicable
Full name   Martin Welsh
Contact address   Randgold Resources Limited

3rd Floor, Unity Chambers

28 Halkett Street

St. Helier

Jersey

JE2 4WJ
Phone number & email   +44 1534 735 333
martin.welsh@randgold.com
Other useful information
(e.g. functional relationship with the person or legal entity subject to the notification obligation)
   
C: Additional information
 
 
Contact:

RNS
Customer Services
0044-207797-4400
rns@londonstockexchange.com
http://www.rns.com

LikeTweet

jueves, 6 de noviembre de 2014

Bristow Hunts for Mine Purchases as Gold Slump Augurs Fire Sales

Mark Bristow, who built Randgold
Resources Ltd. (RRS) by making discoveries across Africa, is turning
to acquisitions as a slump in the bullion price forces rivals to
consider selling mines.

Gold fell to a four-year low of $1,137.94 an ounce
yesterday, below the production costs of seven out of 19
companies tracked by Bloomberg Intelligence, including Harmony
Gold Mining Co. (HAR), South Africa's third-largest producer, and
Primero Mining Corp. (P)

Bristow, chief executive officer of Randgold, sees the
chance to buy mines in Africa that would have once been beyond
the Jersey-based company's reach as peers struggle with debt and
falling profits. AngloGold Ashanti Ltd. (AU), the world's third-biggest producer, said this week it was putting mines up for
sale to cut debt.

"Everyone would like to sell assets that they don't
want," Bristow said today in an interview in London. "We want
assets they don't want to sell. It's going to come as a surprise
to the market as people realize they have to do it. There's
going to be a tipping point."

Bristow said buying a mine, rather than a company, is
Randgold's preferred option.

"Driven by circumstances I believe there are going to be
some opportunities," he said.

Trashed Opportunity

Under Bristow, a geologist by training, Randgold has
generally shied away from doing deals. The gold producer built
its business by finding its own mines, making discoveries in
Mali, Senegal and Ivory Coast. The exception was the 2009
acquisition of Moto Goldmines Ltd. with AngloGold.

As gold prices fell 4.7 percent last week, the Standard &
Poor's/TSX Global Gold Sector Index of 40 producers plunged 16
percent.

Randgold is the best-performing stock in the index in the
past 10 years, rising more than fivefold in the period. The
shares rose 1.2 percent to 3,811 pence as of 12:47 a.m. in
London.

Bristow said many of the gold-mining industry's problems
are self-inflicted as companies racked up debt, chased low-quality assets and over supplied the market during the precious
metal's 12-year bull run.

"A lot of this is deserved," Bristow said. "We trashed
the opportunity of a rising gold price, 10 years of a rising
gold price. We're doing the same again as it comes down. There's
a whole pile wrong."

Ebola Neglect

Bristow was also scathing about the developed world's
response to the Ebola in West Africa. He said the affected
countries were neglected in the early months of the outbreak and
much of the subsequent response has been "hysterical."

"This foolish behavior by so-called first-world countries
and their leadership is damaging," he said. "What it does do
is bring into question the real commitment that the developed
world has to bringing along the rest of the world."

The Ebola outbreak has killed more than 5,000 people,
mostly in Liberia, Sierra Leone and Guinea, according to the
World Health Organization. Randgold has mines in Mali, where
there has been one confirmed case of Ebola, and Ivory Coast,
which borders Liberia and Guinea.

"People play lip service to investment, upliftment and
equality, and it all pales into nothing when you see how people
behave in a situation like this," Bristow said. "You can
manage Ebola. It's not an unmanageable disease."

Randgold today reported a 29 percent decline in third-quarter profit to $58 million, even as sales increased 8 percent
to $376.8 million. The company mined 299,320 ounces of gold in
the quarter at an average cost of $692 per ounce.

The company maintained its full-year production target of
1.13 million ounces to 1.2 million ounces.

To contact the reporter on this story:
Thomas Biesheuvel in London at
tbiesheuvel@bloomberg.net

To contact the editors responsible for this story:
Will Kennedy at
wkennedy3@bloomberg.net
Dylan Griffiths, Ana Monteiro

Press spacebar to pause and continue. Press esc to stop.

LikeTweet

AngloGold Ashanti (AU) Stock Spikes Today After Improved Full Year Guidance

AngloGold Ashanti (AU) Stock Spikes Today After Improved Full Year Guidance


NEW YORK (TheStreet) — AngloGold Ashanti
(AU) shares are up 13.2% to $9.36 on heavy volume Monday after the international gold mining company beat its own third quarter costs and production forecast and narrowed its full year production outlook to the top end of its previous guidance.

The company reported a 10% decrease in all-in-sustaining costs under the previous year to $1,036 per ounce, and an all-in costs decrease of 19% to $1,144 per ounce, while production increased 8% to 1.128Moz, topping guidance.

The company said that its strong performance over the first three fiscal quarters allowed it to tighten its full year production outlook to between 4.35Moz and 4.45Moz from its initial full year guidance of between 4.2Moz – 4.5Moz, despite negative factors such as the sale of its Navachab mine in Namibia and losses associated with earthquakes in South Africa.

Must Read: Warren Buffett’s 25 Favorite Stocks

STOCKS TO BUY: TheStreet Quant Ratings has identified a handful of stocks that can potentially TRIPLE in the next 12 months. Learn more.

“We’ve prioritized and have started working on a range of self-help measures to generate cash from within the current operating base to further deleverage the balance sheet over the medium term. We will also consider the sale or partnership of an operating asset, if required,” said CEO Srinivasan Venkatakrishnan.

TheStreet Ratings team rates ANGLOGOLD ASHANTI LTD as a Sell with a ratings score of D+. TheStreet Ratings Team has this to say about their recommendation:

“We rate ANGLOGOLD ASHANTI LTD (AU) a SELL. This is driven by a number of negative factors, which we believe should have a greater impact than any strengths, and could make it more difficult for investors to achieve positive results compared to most of the stocks we cover. The company’s weaknesses can be seen in multiple areas, such as its generally high debt management risk, poor profit margins and generally disappointing historical performance in the stock itself.”

Highlights from the analysis by TheStreet Ratings Team goes as follows:

  • You can view the full analysis from the report here: AU Ratings Report

AU Chart
AU data by
YCharts

STOCKS TO BUY: TheStreet Quant Ratings has identified a handful of stocks that can potentially TRIPLE in the next 12 months. Learn more.

LikeTweet

miércoles, 5 de noviembre de 2014

Midday Gainers From November 3: Sapient, Covance, Geron And More


Sapient Corporation (NASDAQ: SAPE) +43% – Publicis Groupe announced it will acquire Sapient for $3.7 billion in cash.

Covance Inc. (NYSE: CVD) +25% – Shares are up sharply as the company announced it will be acquired by LabCorp for roughly $5.6 billion.

Geron Corporation (NASDAQ: GERN) – +28% – The company reported that the FDA has removed the full clinical hold on Geron's investigational new drug application for imetelstat.

AngloGold Ashanti Limited ADR (NYSE: AU) +20% – The company announced Q3 results, reporting upbeat metrics. In addition, the company unveiled the Nuevo Chaquiro copper-gold project in Colombia.

ANI Pharmaceuticals Inc (NASDAQ: ANIP) +18% – The company reported financial results Monday morning, beating top and bottom line estimates.

ArcBest Corp (NASDAQ: ARCB) +11% – The company reported financial results showing increased profit from previous year.

See more from Benzinga

  • Numerous Firms Initiate Coverage On Citizens Financial Group Following Quiet Period Expiration
  • UPDATE: Morgan Stanley Initiates Coverage On Twitter
  • Morgan Stanley Calls Spirit Airlines ‘Most Profitable Airline In The World’

LikeTweet

4 Gold Stocks That Can Survive Despite Tumbling Spot Prices

Although, along with oil, gold has been crushed as the spot price continues to fall, that has more to do with dollar strength than any actual failure of the precious metal to hold value. Still, it doesn't make it any easier for investors that have been hammered on both sectors. The precious metal team at RBC dissected the top companies in a new research report, looking for stocks that not only can survive, but that may be incredible buys for long-term investors at these levels.

The analysts stressed in the report that investors should consider royalty-stream companies and certain gold producers with lower debt structure and less leverage. They believe the current gold price pullback presents an opportunity to buy gold equities with strong balance sheets that have very attractive risk-reward profiles.

Eldorado Gold Corp. (NYSE: EGO) is rated Outperform at RBC. The company engages in the exploration, development, mining and production of gold properties in Turkey, China, Greece, Brazil and Romania. Eldorado also explores for iron, silver, lead, zinc and copper ores. Its principal properties include Kisladag and Efemcukuru gold mines located in Turkey; Jinfeng open pit and underground gold mine situated in southern China; and the Olympias gold, silver, lead and zinc development project and the Skouries gold-copper development project located in northern Greece.

Eldorado investors are paid a small 0.3% dividend. The RBC price target for the stock is $9, and the Thomson/First Call consensus target is at $8.46. Eldorado closed Tuesday at $5.11 a share.

ALSO READ: 7 Commodities With Collapsing Prices

Goldcorp Inc. (NYSE: GG) is also rated Outperform at RBC on the potential for solid upside. The company operates as a gold producer involved in the exploration, development and acquisition of metal properties in Canada, the United States, Mexico and Central and South America. Over the past years, Goldcorp has been altering its mine plans, cutting spending and disposing assets in order to reduce costs and focus on the most profitable production, which the CEO recently warned may be lower than current 2014 estimates. Overall, the moves place the company on solid financial ground going forward.

Goldcorp investors are paid a 3.2% dividend. RBC has a $34 price target, and the consensus target is $29.25. Goldcorp ended Tuesday at $18.41.

Randgold Resources Ltd. (NASDAQ: GOLD) is a top mid-cap stock to buy, and it has recorded solid production so far this year from its flagship Loulo-Gounkoto complex in Mali. This increased production has set Randgold up to hopefully achieve its guidance for the year. At the same time, the developing Kibali mine in the Democratic Republic of Congo remains on track to reach its forecast target despite commissioning disruptions. The company has substantial proven and probable reserves totaling 15 million ounces.

Investors in Randgold are paid a 0.6% dividend. We could not find a current rating or price target on the stock from RBC. The consensus target is $88.26. Shares closed trading Tuesday at $59.75.

Silver Wheaton Corp. (NYSE: SLW) is a royalty and streaming stock that the RBC analysts feel very positive about, and they have a rating of Outperform on it. The company has 20 long-term purchase agreements associated with silver and gold relating to 23 mining assets. Its principal portfolio includes silver and precious metal streams on the Barrick's Pascua-Lama project, Hudbay's Constancia project and Vale's Salobo and Sudbury mines.

Silver Wheaton shareholders are paid a 1.4% dividend. RBC has a $31 price target, and the consensus target is posted at $28.38. The stock closed Tuesday at $17.22.

ALSO READ: The 10 Safest High-Yield Dividends

Investors looking to add a portfolio allocation of gold and precious metal stocks should consider scaling in some capital now. Sentiment is horrible, and that is always the time to take a contrarian view. At current price levels, the interest in Asia usually picks up for retail buyers. In addition, the world geopolitical situation always remains dicey, and believe it or not, there may be inflation down the road.

LikeTweet